Once your budget is uploaded, you can check its figures, compare it with actuals in any report, and show it in dashboard charts. To upload a budget first, see How to add a budget or forecast.
1. Check the budget figures
- Go to Load Data > Budgets & Forecasts.
- Click View and Edit next to the budget.

The budget opens month by month. You can also change figures and add months there — see How to view and edit a budget in ScaleXP.
2. Compare the budget with actuals in a report
Option 1: Choose a budget column layout
- Open a report, or create one with + New.
- Click the Columns dropdown at the top of the report.
- Type budget in the search box and choose a layout — for example Budget by Month (set current as starting month) to show the budget month by month, or Month & YTD Compared to Budget to compare it with actuals.
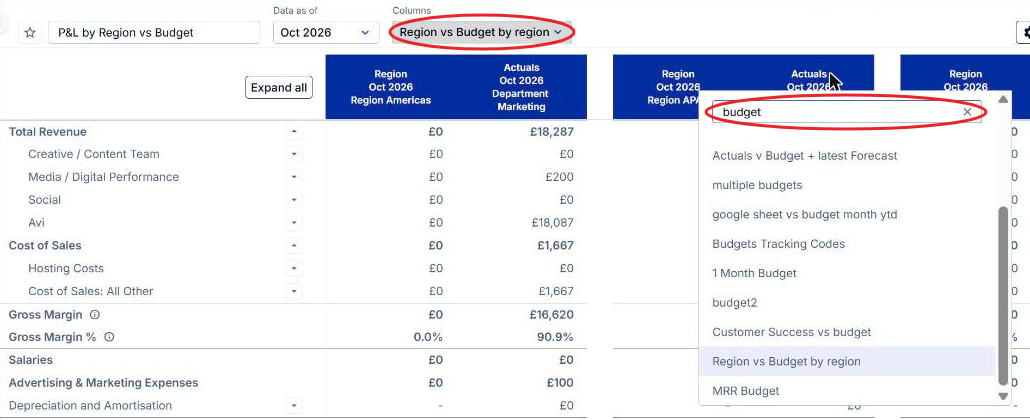
Option 2: Build your own budget columns
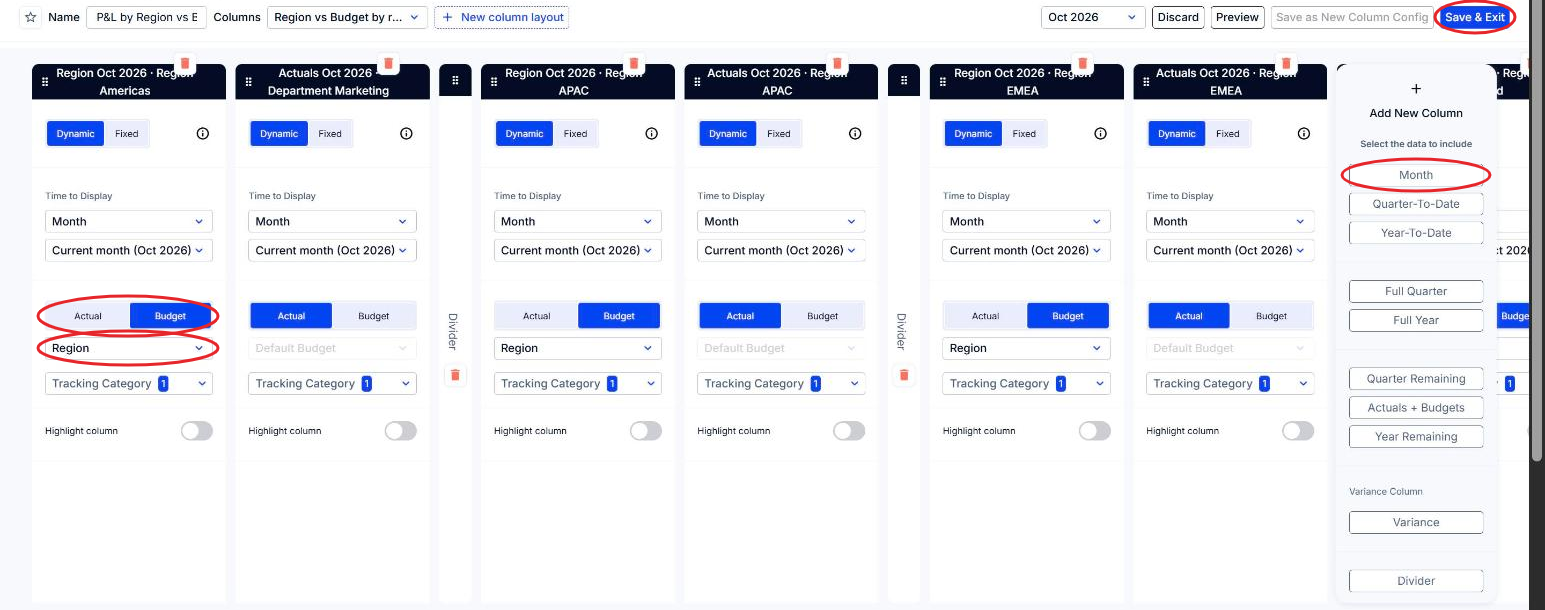
- Click Edit, then Edit columns.
- Under Add New Column, choose a time period, then click Budget and choose the budget.
- Click Save & Exit, or Save as New Column Config to reuse the layout in other reports.
To compare several budgets in one report, see How to add multiple budgets or forecasts to a report.
3. Show the budget in a dashboard chart
In Dashboards, add a budget series to a chart to plot budget against actuals over time. See How to customize a chart and How to add an ARR budget to a graph.